Making Rwanda's health post operations data visible and actionable
Executive summary
After rolling out operational data collection activities, SFH needed a reliable way to track whether operational interventions were actually improving health post-performance. I helped shape how operational data was visualised, and shared by designing Umuko dashboards, and a weekly operational mailer that surfaced key metrics - such as clinician licensing compliance and health post profitability - to teams and stakeholders.
Together, these tools gave SFH a single source of truth for health post operational performance data, enabled earlier intervention when issues emerged, and shifted teams from reactive reporting to proactive, data-driven decision-making for future interventions.
health posts' Operational Data digitised and tracked, with clear processes and governance for updating and maintaining the database
linical staff Have valid licenses with complete oversight preventing service interruptions
Finiacially profitable health posts identified
Data streams consolidated
All operational data centralised from previously scattered spreadsheet systems
Context
Client: Society for Family Health (SFH) Rwanda, Role: Product designer, Timeline: January 2024 – December 2025
Health posts are the first point of care for most Rwandans. While clinical data was already captured through EMRs, operational data - covering staffing, finances, infrastructure, equipment, and support - was fragmented across spreadsheets or missing entirely. This made it difficult for operational teams to understand what was happening on the ground and whether interventions were working or not. Sand collaborated with SFH to launch a programme named Umuko to help find solutions to these issues.
Problem
To understand the link between health post operational efficiency and clinical outcomes, SFH launched an extensive data collection effort in collaboration with Sand, called Umuko. SFH needed to answer practical questions such as:
Clinical service availability and delivery
- How many clinicians do they have, and how many of them have valid licenses today?
- Which health posts are profitable, and why? (Rwanda's health posts operate as small businesses)
- Are health posts well-equipped to treat patients and capture data?
Intervention impact
- Are their interventions actually improving key performance metrics, e.g., health worker retention rate, patient satisfaction, patient cost to serve, etc.?
- How self-reliant are health posts when it comes to operational support?
Without a standardised way to analyse and communicate this information, teams spent significant time hunting for data and manually compiling reports - slowing decision-making and limiting impact.
Research and Process
In close collaboration with SFH’s operational support teams, I aimed to understand how they currently stored and utilised their data, what decisions they regularly made, and where reporting gaps existed.
We had in-person and remote working sessions where SFH provided a deep dive into their current operations and challenges related to data access and what is needed for. We had one obvious but crucial finding - SFH did not have a centralised place to access health posts data. We had solved the issue of data collection by using Airtable, but now it was time to make it useful and easy to access.
Tied to evaluating the impact of interventions carried out, we also learned that reporting was another pain point. Dozens of hours per month were spent on creating reports for funders and internal stakeholders - this was time SFH staff could be devoting to supporting health posts. When looking at these reports, we found that we could automate them.
Solution
We decided to build an online platform (we named it Umuko, after the programme) where Health post Airtable data was sent to a data warehouse, cleaned, and surfaced through embedded Superset dashboards. Although not perfect, the embed allowed us to iterate quickly on the dashboards without an over-reliance on front-end engineering, ensuring quick value delivery to SFH. This rough solution has set the perfect foundation for us to take the lessons learned and refine the platform into a refined product with consistent user experience.
The platform's dashboards provided visibility into:
- Human resources: staffing configuration, license status, expiries, and gaps
- Finance: expenses, income, and profitability per health post
- Equipment: availability, working status, and assignment
- Operational support: support ticket status, priority, and ownership
- Programme monitoring: impact of interventions on key metrics
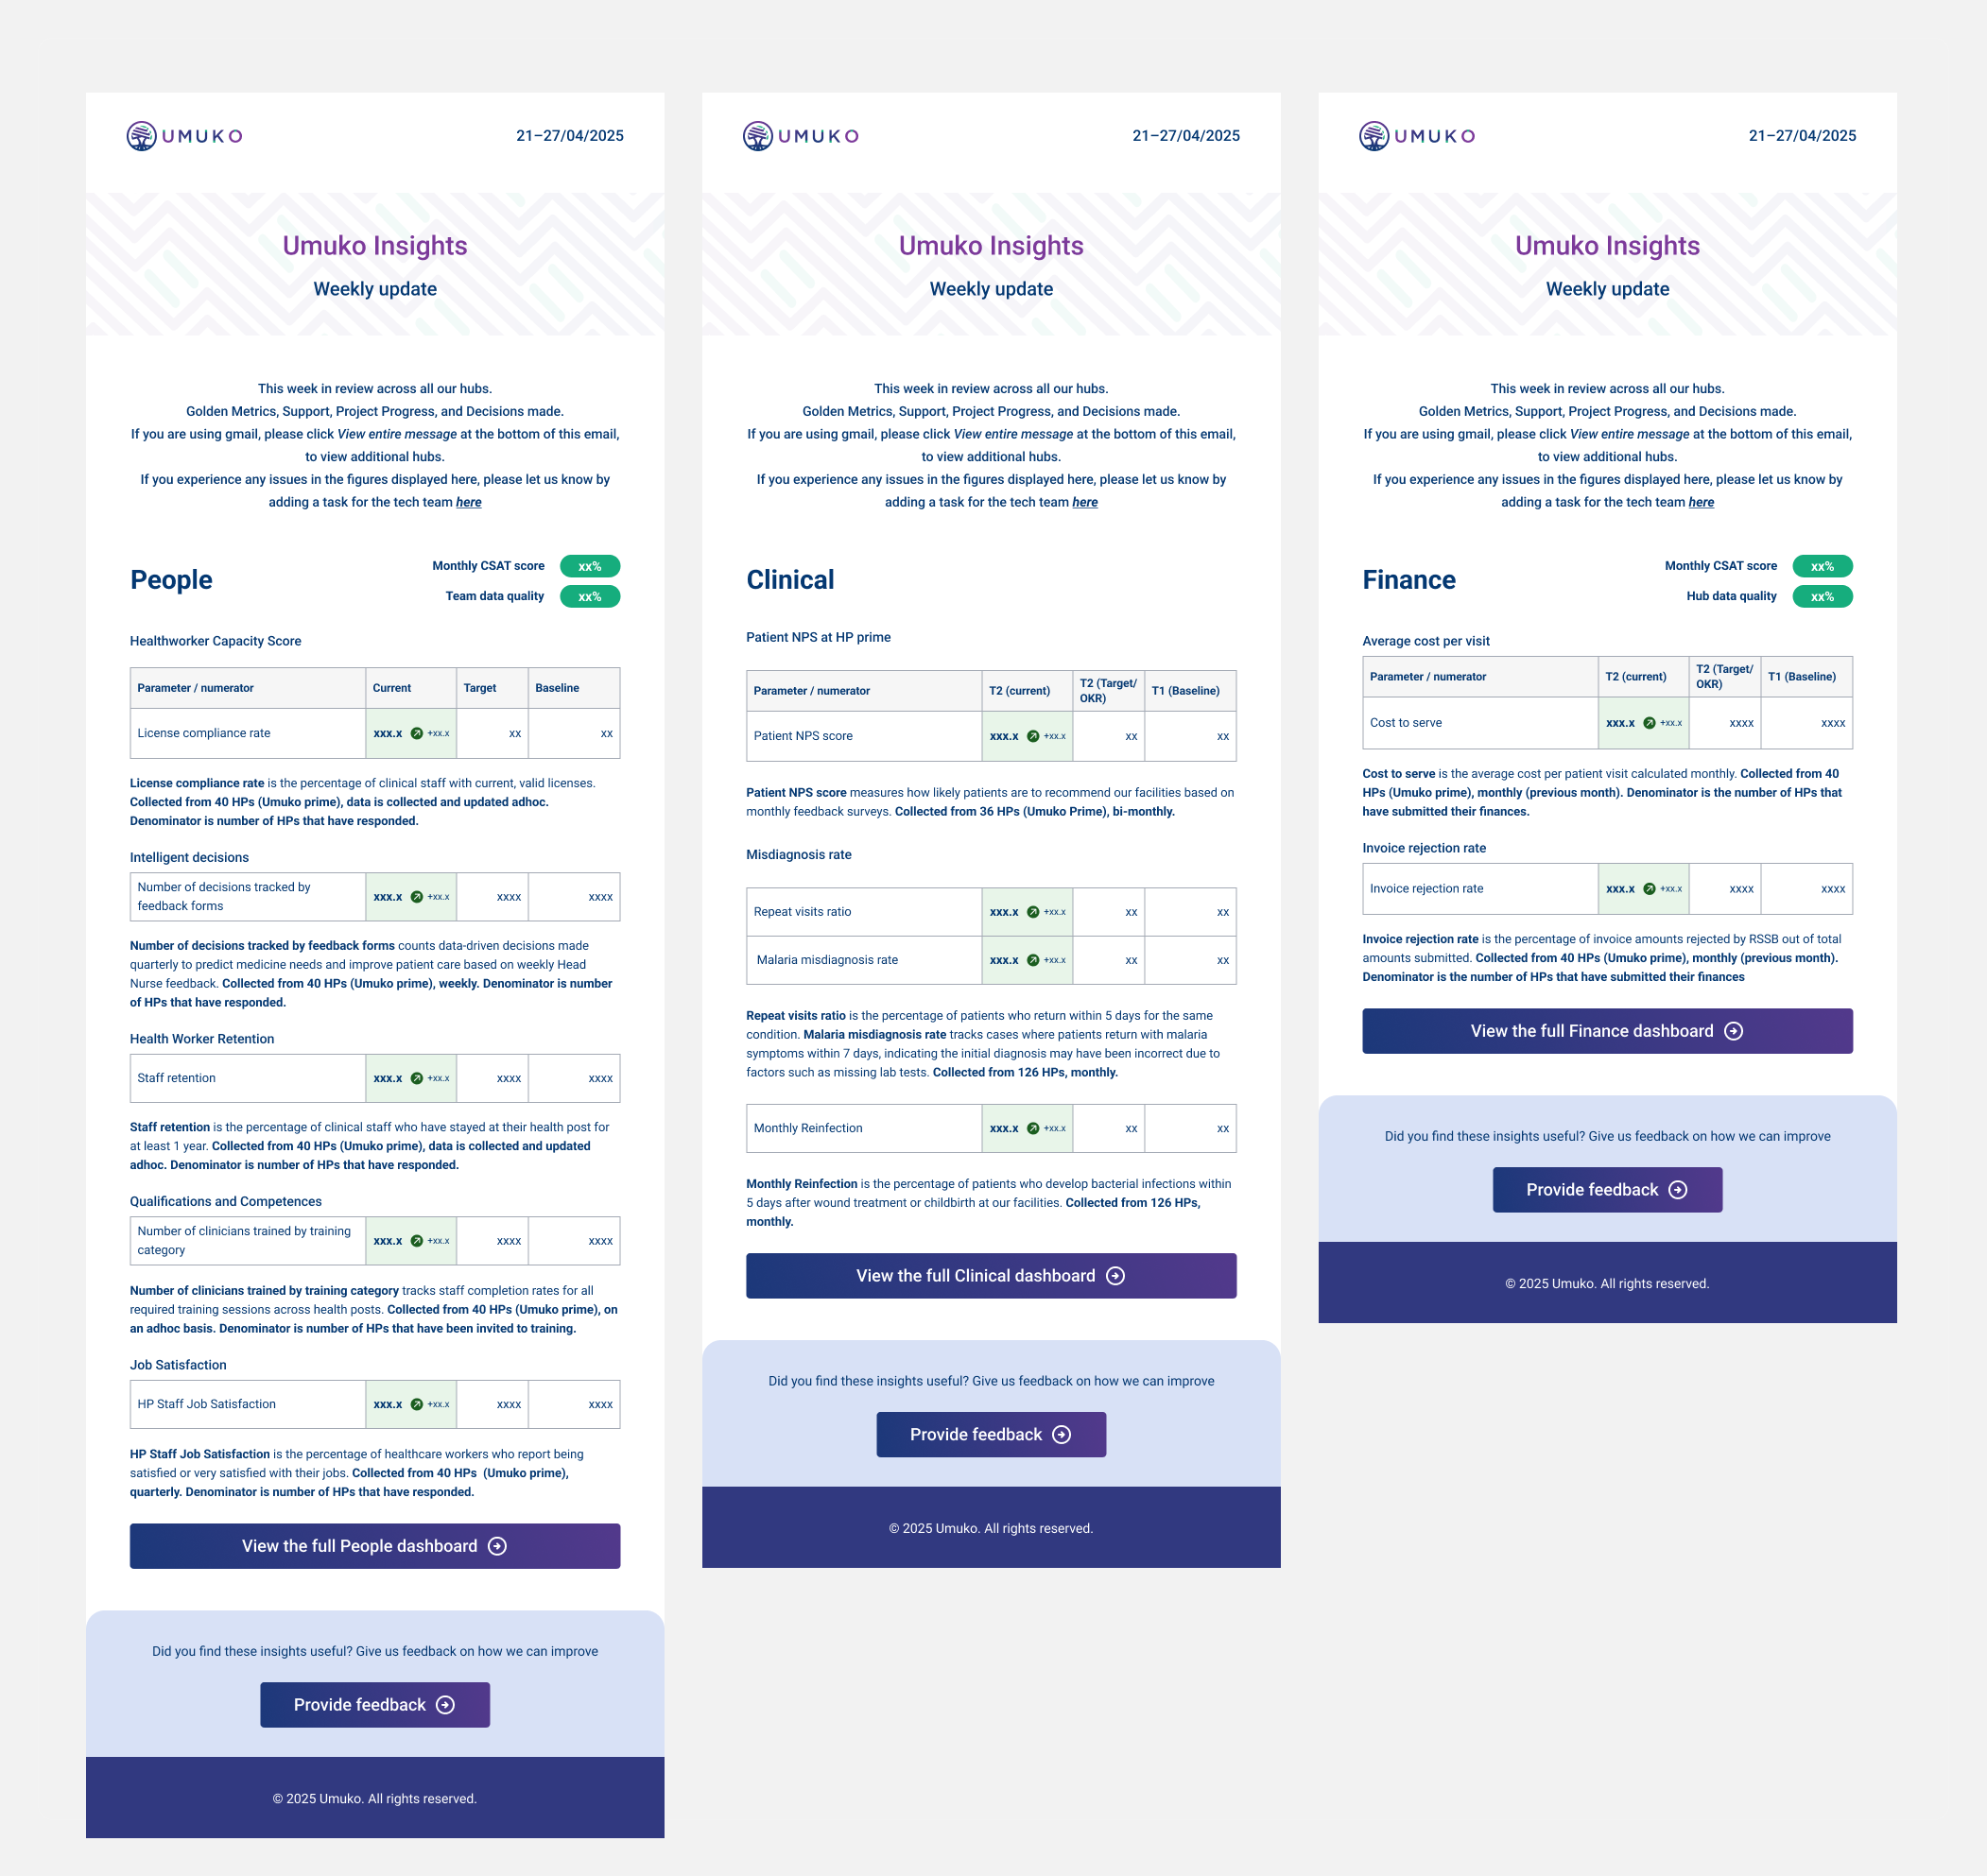
Weekly operational mailer
To ensure the data actually drove action, I created a weekly operational mailer that automatically reported on key metrics (which the team have taken to calling “Golden Metrics”) and trends to teams and stakeholders.
The mailer highlighted indicators such as:
- Percentage of clinicians with valid licenses
- Number of profitable health posts
- Changes in data quality over time
This gave teams a consistent, low-effort way to track performance, understand whether interventions were moving the needle, and align discussions around a shared set of numbers - without needing to dig through dashboards.
Impact
Infrastructure improvements
Using eOps data, teams identified recurring infrastructure issues across health posts. As a result, improvements such as retaining walls, ceilings, toilets, and doors/windows were implemented at four health posts (three still in progress). The data will continue to be used to monitor longevity and plan maintenance.
Staff licensing compliance
SFH now has full visibility into licensing status for 161 clinical staff. At the time of writing, only 5 staff (3.11%) had expired licenses, with active follow-up in place. This significantly reduces the risk of service disruption as clinicians are not allowed to serve patients without valid licenses.
Health post profitability
Financial data across all health posts is now visible. 4 health posts are currently profitable, and teams are using the data to analyse cost drivers and develop prescriptive interventions to improve sustainability.
Data quality monitoring
Routine tracking of EMR and eOps data quality has been established, reinforcing accountability around timeliness, completeness, and consistency - critical for team decision-making and future AI-enabled initiatives.
Reflections and lessons learned
- Data only creates value when it is acted on. The weekly mailer was as important as the dashboards in closing the loop between insight and action.
- Operational data is foundational. Without it, higher-level analytics and AI initiatives are built on shaky ground.
- Visibility changes behaviour. Regular, shared reporting helped teams prioritise issues earlier and align around outcomes rather than anecdotes.
- Development cycles take time, and prototyping can go beyond Figma designs, therefore, creating the quickest path to value in whatever format is always the best approach and lays the foundations for the final version of a product.